A nimbler way to track alcohol use: mining Twitter and Google searches

Large, survey-based studies are a slow, expensive way to collect rigorous public health data. New research, focusing on alcohol use, shows that mining Twitter and online searches could enable public health professionals to get immediate, localized insights, spot emerging trends, and even measure the effects of interventions.
“Online user-generated data are fluid and nimble — and have the potential to be really rich sources of information in specific geographic areas and during tight time intervals,” says study principal investigator Elissa Weitzman, ScD, MSc, of the Division of Adolescent/Young Adult Medicine and the Computational Health Informatics Program at Boston Children’s Hospital. “We set out to draw a relationship between these novel data and established, curated, nationally representative survey data.”
Alcohol use is hard to track accurately at the local level. Drinking patterns may vary based on local culture, policy changes, and awareness campaigns. And large-scale surveillance systems aren’t fine-grained enough to detect the effects of local anti-alcohol campaigns.
“These systems are constructed to create a population-representative picture – they don’t usually reflect local patterns or shed light on the effects of local or regional interventions,” says Weitzman. “By examining online interactions, there’s the potential to rapidly evaluate health activity and translate what you’ve learned into public policy and programming. You can get out in front of things.”
Matching searches and tweets with self-reported drinking
The study, published in the American Journal of Preventive Medicine, shows that online data closely match formal, large-scale surveillance data and could help monitor the effects of local alcohol control policies.
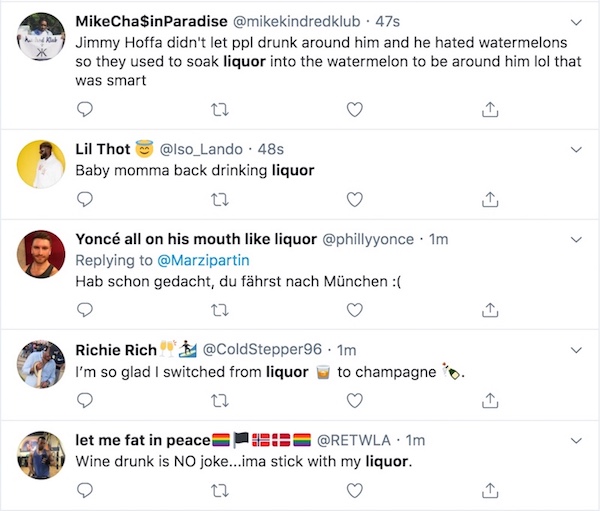
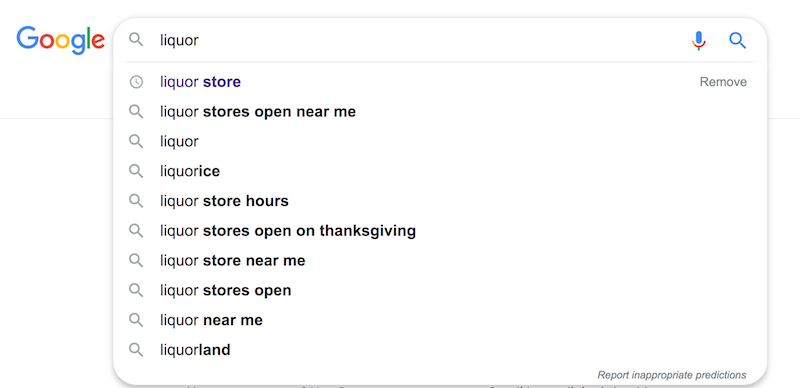
To start, Weitzman and her colleagues used Google Trends data to estimate search volumes for seven keywords (alcohol, alcoholic, alcoholism, drinking, beer, liquor, wine) relative to all Google searches. They also estimated the proportion of Twitter posts broadcasting personal alcohol use, using natural language processing algorithms to classify tweets and eliminate “false positives” (like tweets referencing “drinking” in a non-alcohol context).

The team then took these estimates state by state and compared them to alcohol-related survey responses in the same state, from the national Behavioral Risk Factor Surveillance System (BRFSS). Questions included: “During the past 30 days, how many days per week or per month did you have at least one drink of any alcoholic beverage such as beer, wine, a malt beverage, or liquor?”
Of the BRFSS survey’s nearly 1.3 million respondents in 2014-16, 53 percent reported recent alcohol use. Weitzman and colleagues found clear associations between a survey respondent’s use of alcohol and the relative volume of alcohol-related searches and tweets in the respondent’s state during the year and month they were surveyed. The relationships held in sub-analyses that looked at the reported frequency and amount of drinking.

“It was astonishing to me that we could see this,” says Weitzman. “On the other hand, it was exactly as expected, because the online world represents a powerful source of influence on behavior and can be a fairly accurate mirror of reality.”
Tracking the effects of alcohol policies
In states with strong alcohol policies (like increasing the price of alcohol, limiting happy hours, and regulating public consumption), survey respondents were less likely to report drinking, even in areas with lots of alcohol-related searching and tweeting. This suggested that the prevailing “alcohol environment,” as captured by online behavior, had less of an influence on an individual’s drinking than local policies.

“This is sound evidence of alcohol policies working as intended,” says Tim Naimi, MD, MPH, of Boston Medical Center, a coauthor and leading expert on alcohol policy.
The study lays a groundwork for tracking emerging alcohol-related public health concerns.
“Informal social media and search data may be really important for detecting and responding to things that we don’t anticipate – or that occur naturally,” says senior author Lauren Wisk, PhD, formerly of Boston Children’s and now at UCLA.
“Our results give confidence in our public health tools and in using novel data approaches to measure health behaviors and policy effects — a real win,” Weitzman adds.
Co-authors on the study, in addition to Wisk and Naimi, were Kara Magane, MS, formerly of Boston Children’s Hospital and now at the Boston University School of Public Health, Po-Hua Chen, MD, of the Harvard T.H. Chan School of Public Health, and Hadi Amiri, PhD, of Harvard Medical School. The study was supported by the NIH National Institute on Alcohol Abuse and Alcoholism (R21AA023901).
Related Posts :
-

The hidden burden of solitude: How social withdrawal influences the adolescent brain
Adolescence is a period of social reorientation: a shift from a world centered on parents and family to one shaped ...
-

A better treatment for endometriosis could lie in migraine medications
Endometriosis is a common, mysterious, often painful condition in which tissue similar to the uterine lining grows outside the uterus, ...
-

Keeping up with the tween skin care trend: What’s in those products?
More teens and tweens are hitting the mall to grab skin-care products they’ve seen on social media — but are ...
-

Will people accept a fentanyl vaccine? Interviews draw thoughtful responses
In 2022, more than 100,000 people died from opioid overdoses in the U.S., according to the National Center for Health Statistics. ...


