

Disparities in travel time to COVID-19 testing sites may bias case estimates
As the U.S. economy begins to reopen after two months of lockdown, states and counties are using local data on COVID-19 incidence to inform their plans. But a new analysis highlights an inconvenient truth. Geographic access to COVID-19 testing sites is as uneven as access to health care overall, meaning that local estimates of COVID-19 spread may be incorrect.
The peer-reviewed study, published in the Journal of Travel Medicine, found higher travel times to COVID test sites in rural counties and those with a larger non-white or uninsured population, suggesting that COVID cases are potentially under-counted in these areas.
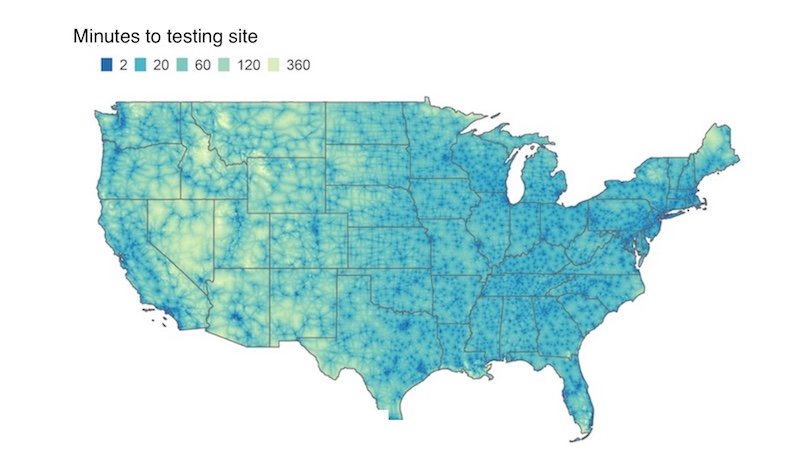
· Travel times to COVID-19 testing sites are unequal around the country.
· People in rural counties and counties with more non-whites and low rates of health insurance face longer travel times.
· These disparities may lead to under-counting of coronavirus cases.
“We’re only seeing a very small sliver of information about this epidemic, and we know that some of that information is biased,” says Benjamin Rader, MPH, of the Computational Epidemiology Lab at Boston Children’s Hospital.
Rader and fellow lab member Christina Astley, MD, ScD, set out to systematically quantify geographic accessibility of testing sites — specifically travel times — in every county of the U.S. They tapped two national databases to identify more than 6,000 coronavirus testing sites. Then, using a high-resolution map and published non-air travel times, they calculated how long it would take people to get to a test site.
Overall, they found, 30 percent of the U.S. population lives in a county where the median travel time to a testing site exceeds 20 minutes. They also found pronounced regional disparities. In some areas, up to 86 percent of the population lived in a county where the median travel time topped 20 minutes. In others, only 5 percent did.
“We don’t know all the driving factors behind where the testing sites were located,” notes Astley, also in the Division of Endocrinology at Boston Children’s. “But a lack of testing sites in an area doesn’t necessarily mean that there’s not a lot of disease there. Long travel times are known to be an important barrier to care. If people wait longer to present for testing, they may not be included in local estimates of disease burden.”
Barriers for rural and uninsured populations
Not surprisingly, counties with higher population densities had shorter travel times to test sites. Rural areas, especially in the Mountain region, had longer times.
Travel times were also longer in counties with more non-white people or uninsured people, even after factoring in population density. Moreover, further analyses found that longer rural travel times are exacerbated in counties where more of the population is uninsured.
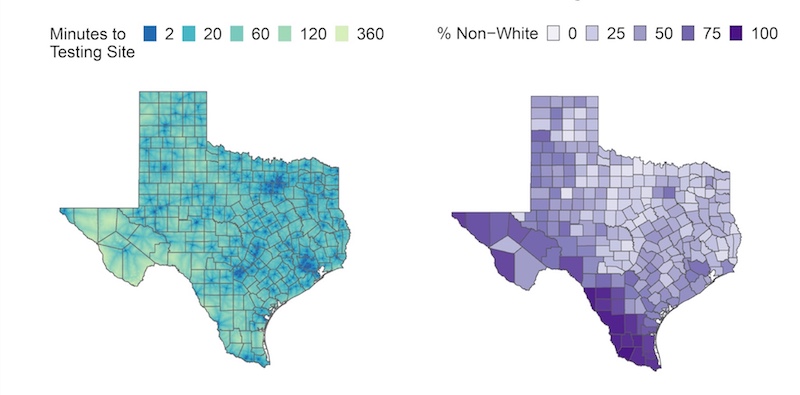
“The people in these counties have a double hit,” says Astley. “Not only are they traveling farther, on average, because they live in a rural area, but also because they don’t have health insurance.”
Of note, in urban areas, travel times were calculated based on the fastest travel method. The researchers couldn’t account for individual differences, like people without cars who face lengthy trips on buses and subways.
“People of lower income may not have access to the fastest way to get somewhere,” says Rader. “It’s likely our disparities are understated.”
Rethinking population testing for COVID-19
Despite what we may see on TV, drive-through locations accounted for only 3 percent of COVID-19 test sites in this database. Most sites were affiliated with medical centers (43 percent) or urgent care providers (47 percent).
And therein may lie the problem.
“We need to rethink points of testing, especially for vulnerable populations that have trouble accessing medical facilities in general,” says John Brownstein, PhD, who heads the Computational Epidemiology Lab and is also Boston Children’s chief innovation officer. “If we use the existing framework of testing, we’re just exacerbating the disparities. We can utilize these mapping methods to pinpoint areas where there are gaps.”
We need to rethink points of testing, especially for vulnerable populations that have trouble accessing medical facilities in general.”
— John Brownstein
Availability of COVID-19 testing has improved in recent weeks as new sites have opened. Since the published study used data from April, Astley and Rader re-ran their analysis after press time with test-site data pulled in early May. Median travel times did fall, but the overall pattern of inequities remained.
The researchers now plan to explore how unequal geographic access to test sites might affect the public health response, access to care, and, ultimately, people’s outcomes after testing positive for COVID-19.
“In designing a COVID-19 response framework, we risk incorporating the existing biases in our health care system,” says Rader. “We have to make extra effort to ensure Americans have equal access to testing resources.”
Learn more about Boston Children’s response to COVID-19 and COVID-19 research at the hospital.
Related Posts :
-

Model enables study of age-specific responses to COVID mRNA vaccines in a dish
mRNA vaccines clearly saved lives during the COVID-19 pandemic, but several studies suggest that older people had a somewhat reduced ...
-
New insight into the effects of PPIs in children
Proton-pump inhibitors (PPIs) are frequently prescribed to suppress stomach acid in patients with gastroesophageal reflux disease (GERD). Prescribing rates of ...
-
Creating the next generation of mRNA vaccines
During the COVID-19 pandemic, mRNA vaccines came to the rescue, developed in record time and saving lives worldwide. Researchers in ...
-
Firearm suicides in children and youth: A state-by-state look
At a time when mental health problems are skyrocketing, a new study provides one of the most comprehensive state-by-state accountings ...